Quick answer
Listing management becomes a growth lever only when it is run like an operating system, not a checklist. High-performing teams define ownership, set quality gates, run on a fixed cadence, and measure outcomes through a clear KPI tree.
Most teams struggle because listing work is distributed across marketing, operations, and product without one accountable workflow. The result is predictable: inconsistent profile data, unclear reporting, and weak decision velocity.
If you are building repeatable execution, use a listing management tool strategy that treats listings as an ongoing growth process rather than a one-time campaign.
sbb-itb-8e44301
Problem framing
Growth teams usually inherit listings from earlier stages of the company. Some were created manually, some by agencies, some by former teammates, and many are only partially maintained. That fragmented history creates operational drag.
Common symptoms:
- multiple data versions across listings,
- slow turnaround on corrections,
- no agreed SLA for update requests,
- weak visibility into what changed this month,
- no clear link between listing work and business KPIs.
When these issues persist, listing management looks like "maintenance work" instead of an optimization channel. The core problem is not effort level. The core problem is missing operating structure.
Why listing programs stall in growth teams
| Root cause | Operational effect | Business effect | Fix direction |
|---|---|---|---|
| No single owner | Tasks are delayed or dropped | Inconsistent market presence | Assign one accountable owner with decision rights |
| No source-of-truth dataset | Conflicting updates across channels | Lower trust and more rework | Centralize canonical listing inputs |
| No cadence discipline | Work happens only when issues surface | Reactive performance, weak planning | Move to weekly + monthly review loops |
| No KPI hierarchy | Teams track activity, not impact | Hard to justify budget and scale | Define KPI tree from execution to outcomes |
| No escalation rules | Blockers remain unresolved too long | Slow cycle completion | Establish SLA and escalation paths |
A mature listing model converts these failure points into standard operating steps.
Listing operations maturity model
| Maturity level | Typical behavior | Main risk | Upgrade priority |
|---|---|---|---|
| Level 1: Ad hoc | Listings updated only when broken | Data drift and missed opportunities | Centralize core fields and owners |
| Level 2: Managed | Basic process exists but inconsistent | Quality variance between cycles | Add QA checklist and reporting structure |
| Level 3: Repeatable | Fixed cadence and issue logs | Limited strategic optimization | Introduce KPI-led prioritization |
| Level 4: Optimized | Decisions tied to performance signals | Over-complex workflows | Simplify and automate stable workflows |
Most growth teams are between Level 2 and Level 3. The quickest improvement usually comes from better governance, not more tools.
KPI tree for listing management
| KPI layer | KPI examples | Purpose |
|---|---|---|
| Input KPIs | profile completion rate, QA pass rate, correction SLA | Measure execution quality |
| Process KPIs | cycle time per wave, pending issue age, update throughput | Measure operational efficiency |
| Output KPIs | accepted listings, profile consistency score, coverage by priority tier | Measure delivery quality |
| Outcome KPIs | referral trend, branded query trend, assisted commercial visits | Measure business contribution |
Without this KPI separation, teams confuse workload with progress.
Decision framework: what to fix first
Prioritize in this order:
- Data integrity (source-of-truth fields and normalization).
- Workflow reliability (owner, SLA, escalation).
- Reporting quality (decision-ready summaries).
- Scale controls (wave sizing, automation boundaries).
If step 1 is weak, steps 2-4 produce limited value.
How ListingBott works
ListingBott supports listing execution through a structured flow: intake, directory-list approval, publishing, and reporting. It is designed for teams that need consistent delivery and clear status handoffs.
1) Intake and scope definition
Projects begin with a client form that captures business details, category context, and campaign objective. This upfront structure reduces scope drift and keeps execution focused.
2) Directory list preparation and approval
A proposed list is prepared, then approved before broad publishing starts. This approval gate is where relevance and scope are aligned.
3) Controlled publishing and tracking
Publishing runs with status tracking rather than a one-shot push. That makes issue isolation and correction flow more manageable.
4) Report handoff and next actions
Delivery includes a report that clarifies what was submitted, what is pending, and what should happen next. The practical milestone is explicit: report is ready.
5) Promise boundaries and offer alignment
Current offer language is aligned to one-time payment model, publication to 100+ directories (per current website language), no hidden extra fees (per current FAQ language), and refund possibility when process has not started.
ListingBott does not promise guaranteed ranking position, guaranteed traffic by a specific date, guaranteed indexing speed, or outcomes controlled by third-party platforms.
For DR-goal projects, growth to DR 15 can be promised only when all qualifying conditions are met: starting DR below 15, explicit domain growth goal, and approved directory list.
For teams scaling execution, this process can be connected to the broader flow to submit business to directories with clearer governance.
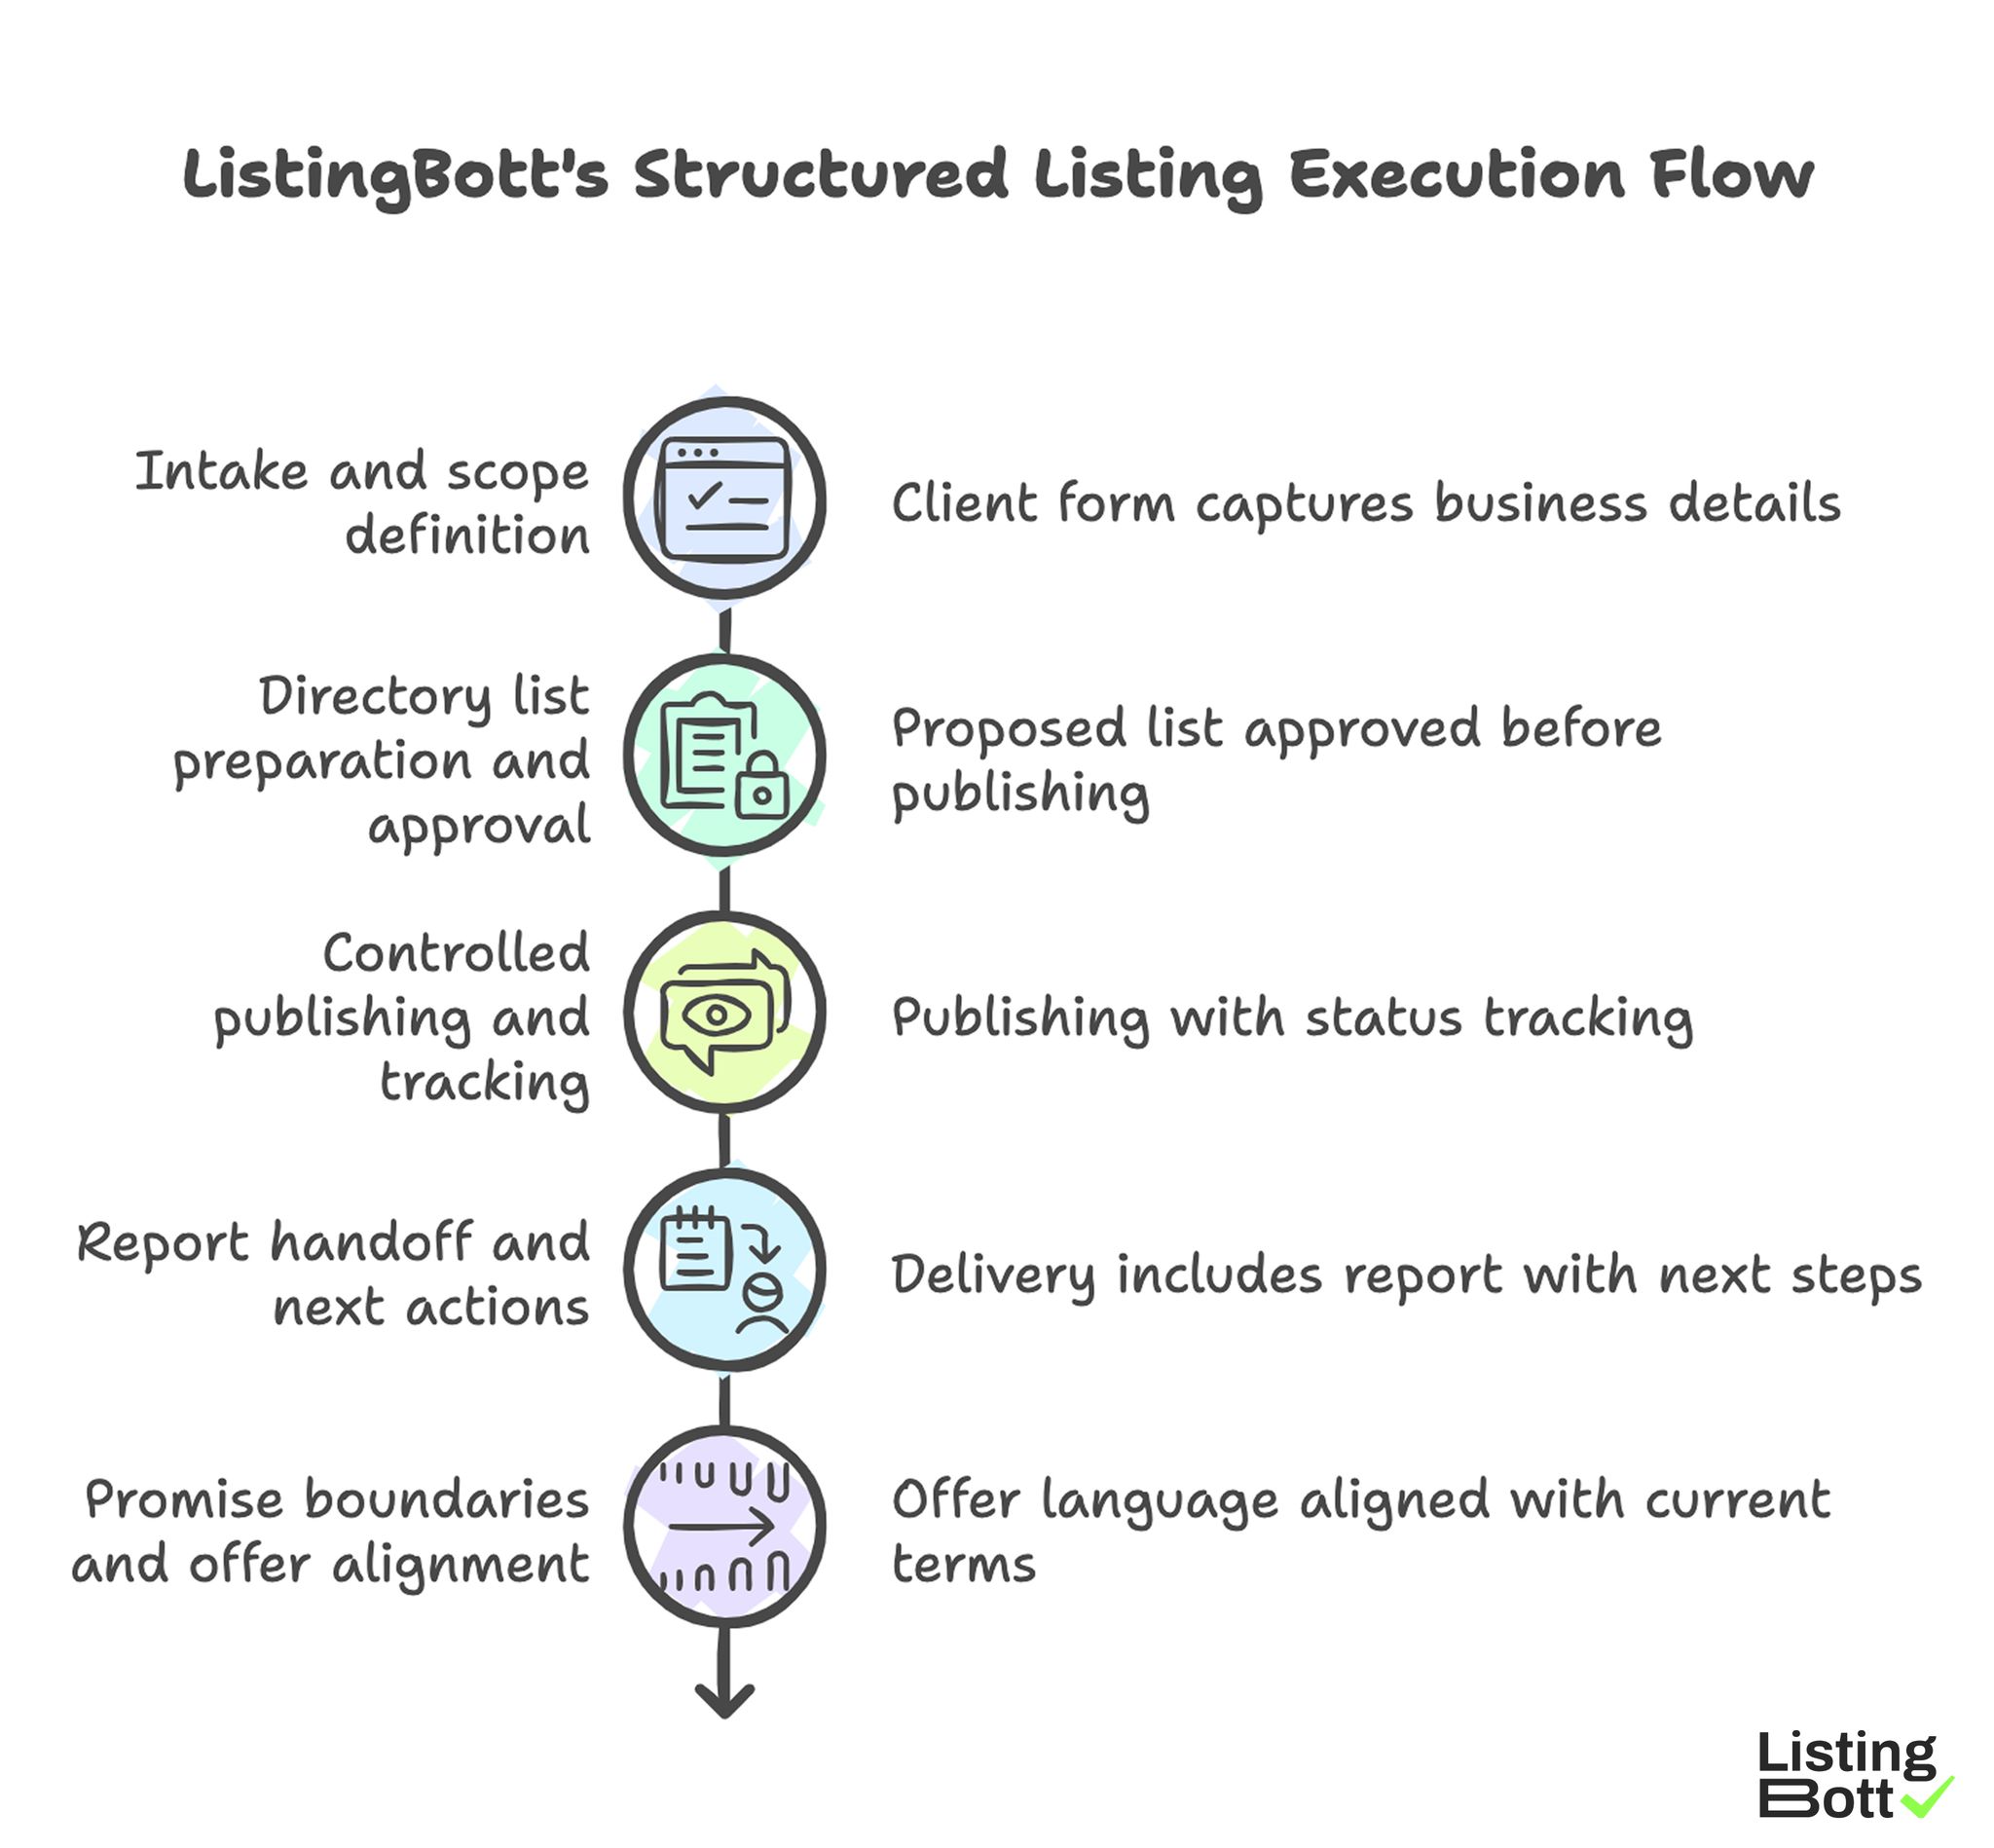
ListingBott’s Structured Listing Execution Flow
Proof/results
Reliable listing outcomes come from operational quality first. Before expecting strong outcome movement, verify that execution quality is stable across cycles.
30-60-90 operating KPI model
| Time window | Primary objective | Must-track KPIs | Expected signal |
|---|---|---|---|
| Days 1-30 | Stabilize data and process | QA pass rate, correction SLA, baseline completion | Fewer urgent corrections and cleaner inputs |
| Days 31-60 | Improve delivery consistency | wave completion rate, pending issue age, consistency score | More predictable cycle execution |
| Days 61-90 | Optimize for contribution | referral trend, branded trend, assisted actions | Better decision confidence for scale |
This timeline keeps expectations realistic and prevents overreaction to short-term variance.
What a high-signal report looks like
A good listing report does not stop at task logs. It should include:
- change summary by cycle,
- unresolved blockers by severity,
- quality trend vs prior cycle,
- KPI movement by layer,
- recommended actions for next cycle.
If recommendations are generic, the report is informational but not strategic.
Control metrics that predict scale readiness
| Control metric | Healthy signal | Warning signal |
|---|---|---|
| Data consistency score | Improves each cycle | Flat or declining despite more effort |
| Correction turnaround | Predictable and within SLA | Backlog grows each wave |
| Wave completion reliability | Stable completion within plan window | Frequent overrun and manual firefighting |
| Decision latency | Next-cycle decisions made quickly | Decisions delayed due to unclear data |
Teams should scale listing volume only when these control metrics are stable.
Interpreting ROI without false certainty
Listing work usually contributes through a chain, not a single direct metric. A practical interpretation model asks:
- Did process quality improve?
- Did quality improvements persist across cycles?
- Did supported outcomes trend positively over time?
This reduces pressure to force short-term conclusions and helps teams allocate budget rationally.
Risk register for growth-team listing programs
| Risk | Trigger | Impact | Mitigation |
|---|---|---|---|
| Ownership ambiguity | Multiple teams edit the same fields | Slow corrections and inconsistent messaging | RACI model and single accountable owner |
| Tool fragmentation | Parallel spreadsheets and ad hoc trackers | Reporting confusion | Centralize workflow and status tracking |
| Scale before stability | Volume increased before QA maturity | Error amplification | Use scale gate based on control metrics |
| Reporting inflation | Large reports with low decision value | Slower strategic decisions | Force recommendation section with owners |
| Expectation mismatch | Outcome promises exceed delivery reality | Trust erosion and churn risk | Use strict promise boundaries in kickoff |
Implementation checklist
Use this implementation plan to turn listing management into a predictable growth workflow.
Phase 1: Governance setup (week 1)
- Define accountable owner and supporting roles.
- Create source-of-truth profile dataset.
- Set correction SLA and escalation rules.
- Define the KPI tree (input/process/output/outcome).
- Set cadence for weekly and monthly reviews.
Phase 2: Baseline and process design (weeks 2-3)
- Audit current listing state by priority tiers.
- Tag high-risk inconsistencies for immediate correction.
- Define standard QA checklist before any new wave.
- Build simple issue log with owner and due date.
- Align reporting template to decision questions.
Phase 3: Controlled execution (weeks 4-6)
- Run wave-based update/submission cycles.
- Measure QA pass rate and correction turnaround.
- Track pending issue age by severity.
- Capture cycle summary with next actions.
- Prevent scope creep via explicit approvals.
Phase 4: Stabilization and optimization (weeks 7-10)
- Remove recurring blockers at root cause level.
- Refine wave size to match team capacity.
- Re-score directory tiers by quality and contribution.
- Tighten KPI definitions where attribution is weak.
- Document what to automate vs what to keep manual.
Phase 5: Scale protocol (weeks 11-13)
- Apply scale gate using control metrics.
- Expand only stable segments first.
- Keep governance model intact during expansion.
- Revalidate reporting quality after each scale step.
-
Update quarterly listing roadmap from measured results.
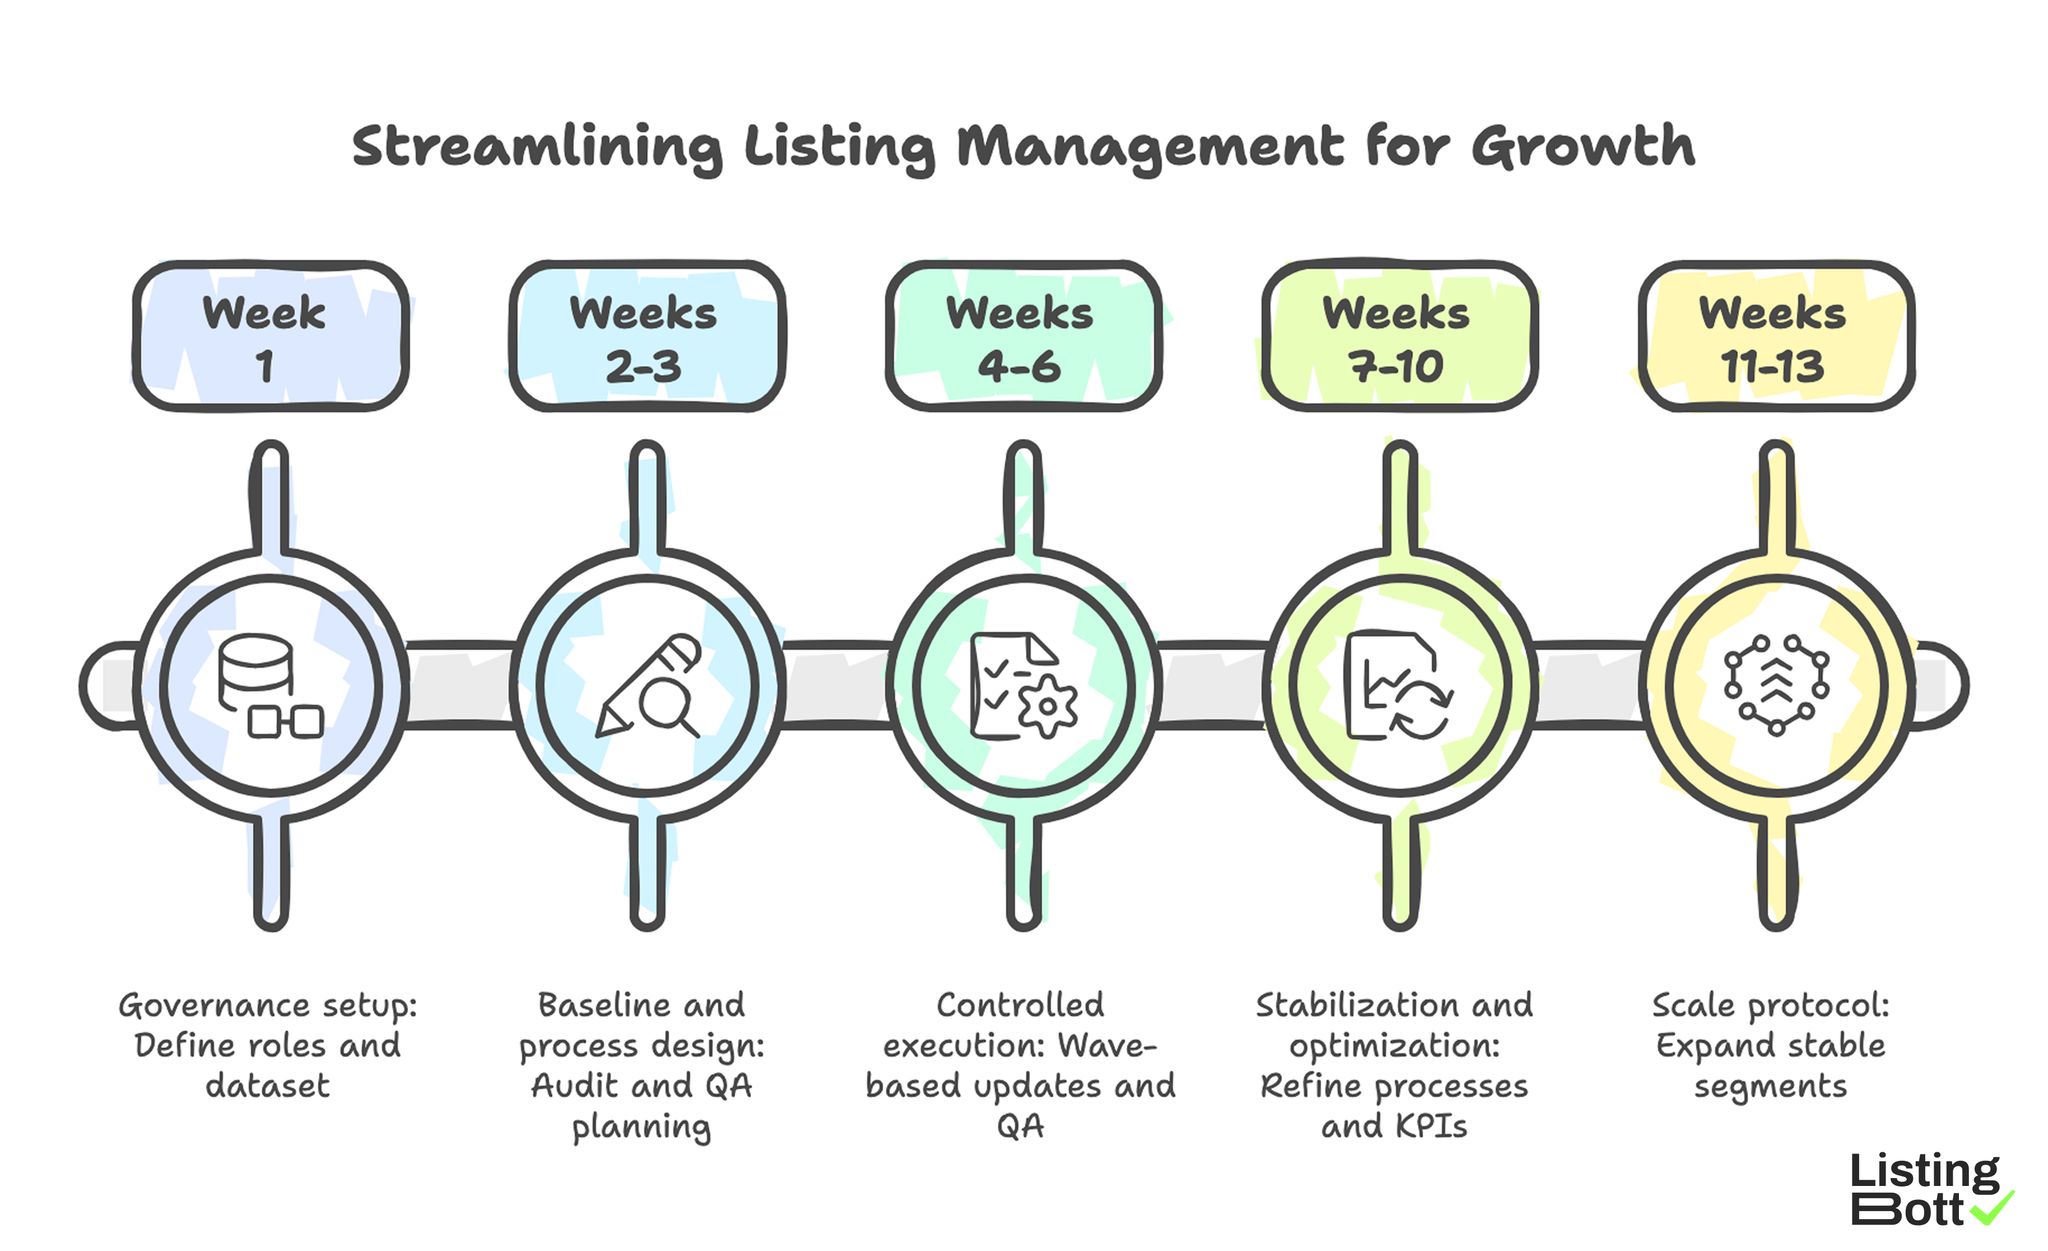
Streamlining Listing Management for Growth
Common implementation mistakes and fixes
| Mistake | Why it hurts | Fix |
|---|---|---|
| Treating listings as side task | No reliable ownership and follow-through | Assign explicit owner with operating authority |
| Scaling volume too early | More errors, slower correction loops | Scale only after stability thresholds |
| Reporting without KPI context | Hard to justify decisions | Map every metric to KPI layer and action |
| Over-automation of unstable steps | Faster creation of low-quality output | Automate only stable, well-defined tasks |
| No post-cycle review discipline | Repeated issues across months | Make retrospectives mandatory per cycle |
FAQ
1) What KPI should a growth team track first in listing management?
Start with QA pass rate and correction turnaround. They are leading indicators for everything else.
2) How often should listing management be reviewed?
Run weekly operational checks and monthly strategic reviews at minimum.
3) Should listing updates be centralized or team-specific?
Centralize source-of-truth data and governance, then delegate execution tasks with clear ownership.
4) When is a team ready to scale listing volume?
When control metrics are stable: high QA pass rates, predictable SLAs, and low unresolved blocker age.
5) Is listing management mainly an SEO task?
It supports SEO, but operationally it is cross-functional work involving growth, operations, and content discipline.
6) Can listing programs guarantee rankings?
No. Responsible programs do not guarantee ranking positions or fixed-date traffic outcomes.
Final takeaway
For growth teams, listing management is a systems problem. The teams that win are not the ones doing the most submissions. They are the ones with the clearest ownership model, strongest quality controls, and best KPI discipline over repeated cycles.