Quick answer
The best business listing strategy is not maximizing the number of submissions. It is prioritizing listing sites that produce strong discovery signals, consistent business data, and manageable long-term maintenance.
Most teams improve outcomes when they:
- score listing categories before submitting,
- launch in waves with quality gates,
- expand only when correction workload is under control.
If you are building your next listing plan, use this framework to choose best business listing sites by strategic value, not by volume.
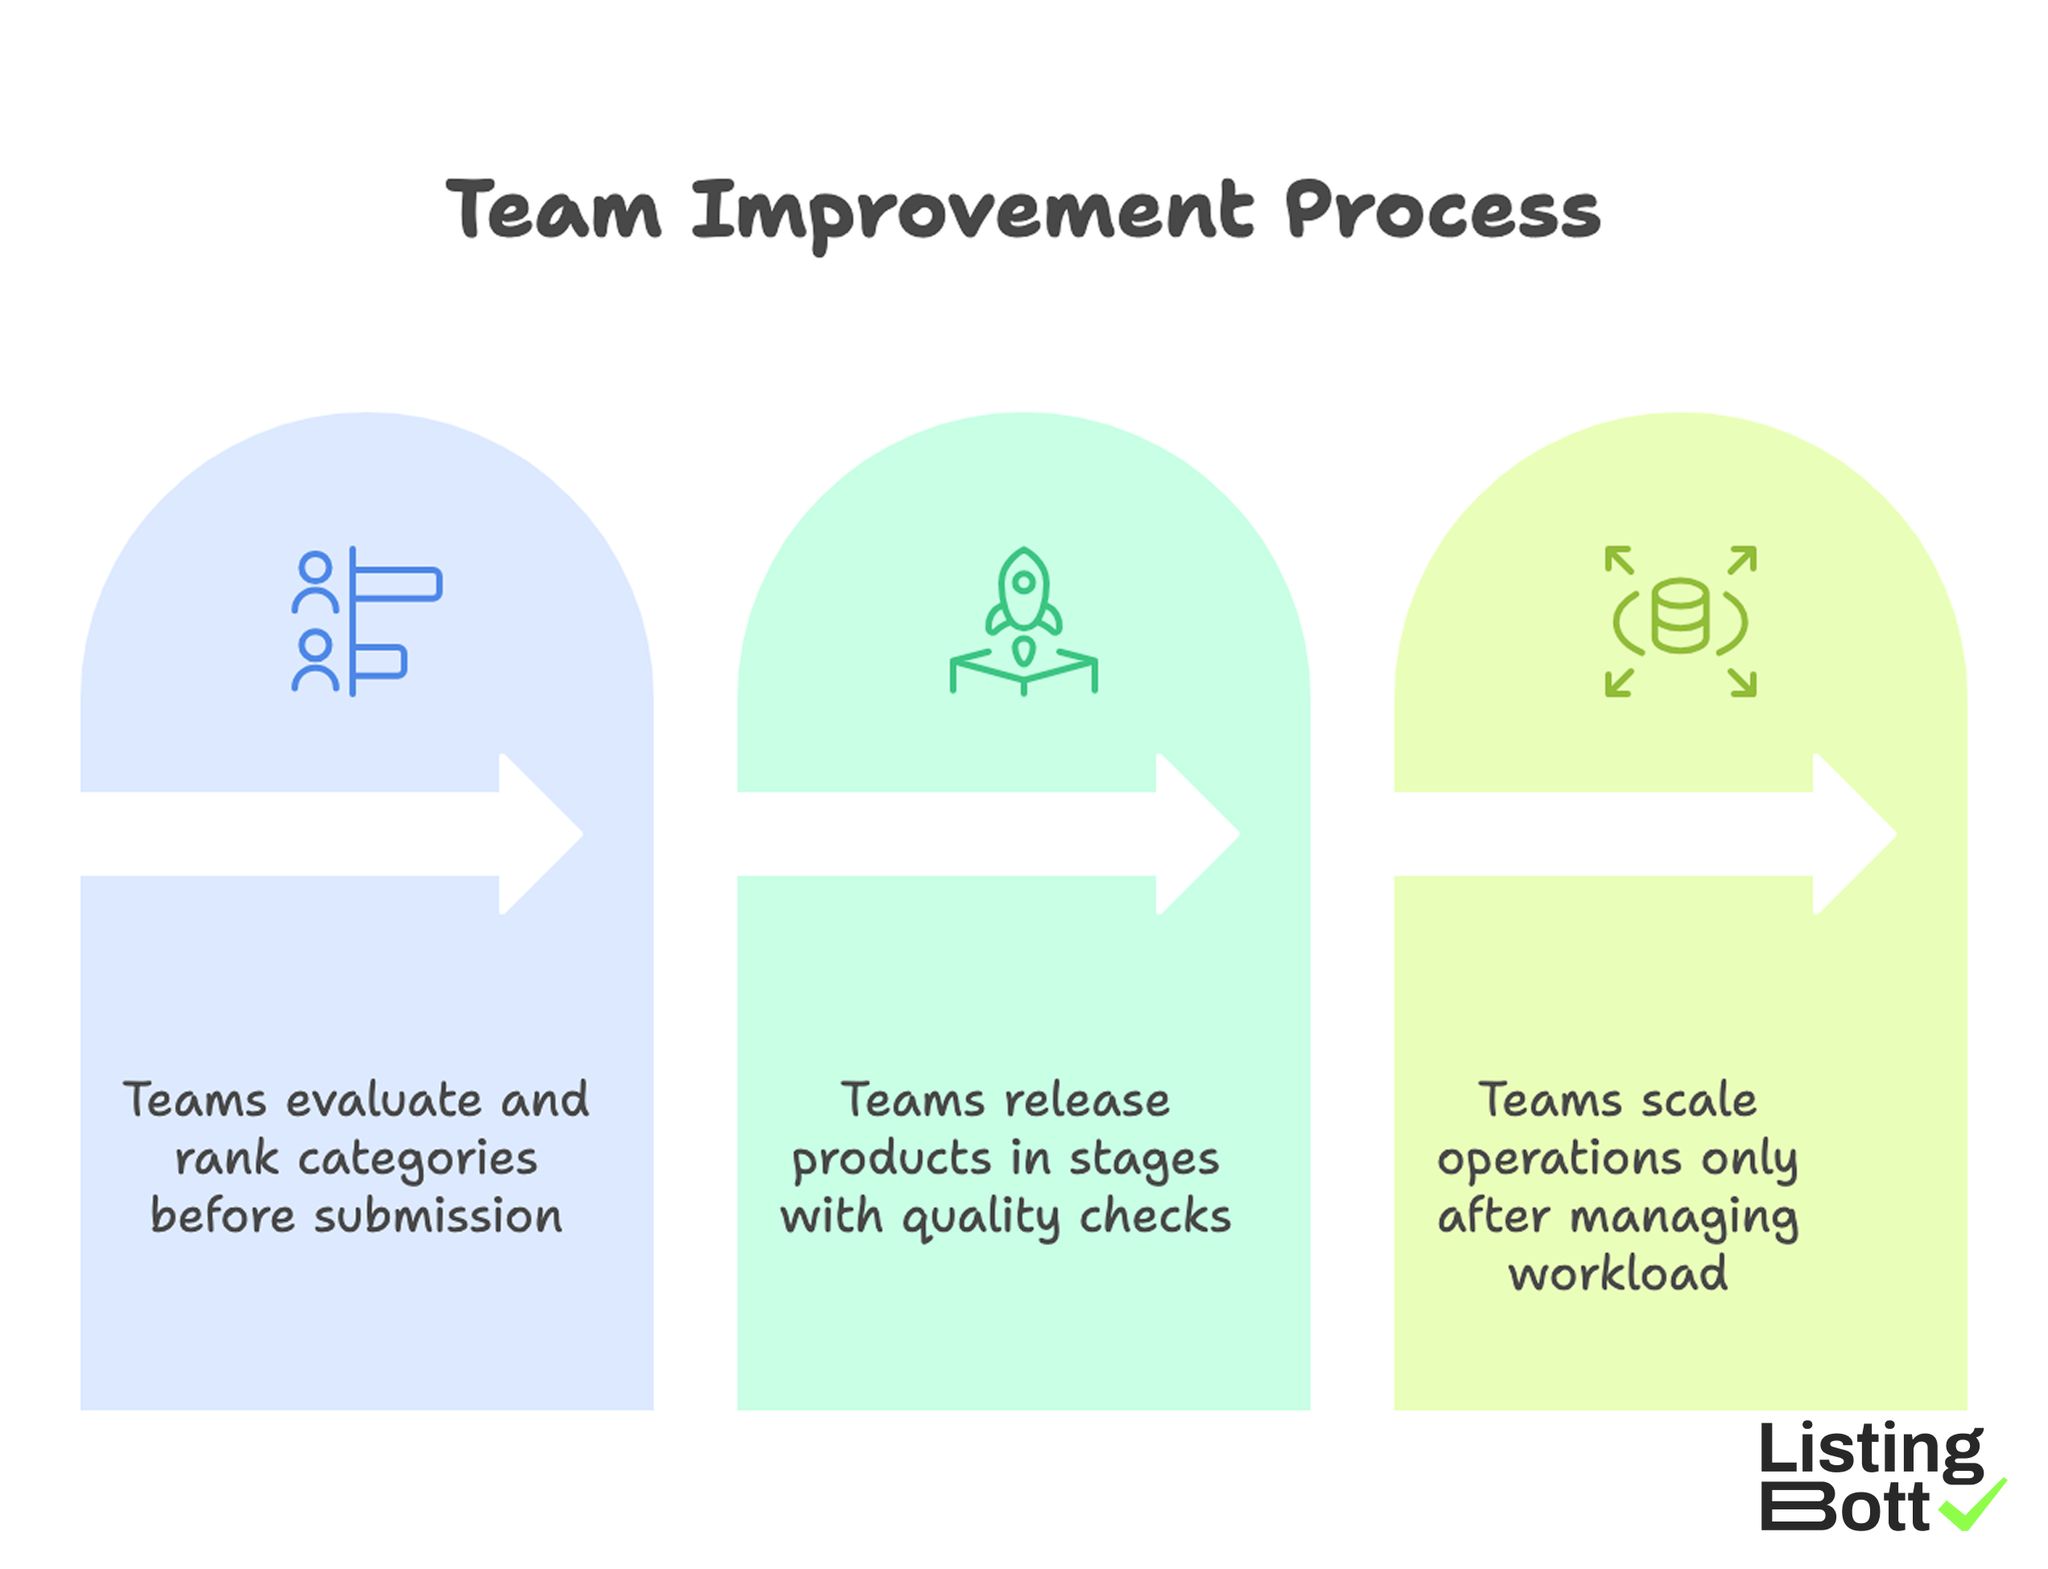
Team Improvement Process
sbb-itb-8e44301
Methodology
This methodology is built for SEO and growth teams that need repeatable decisions. It uses a signal-priority model that weights both visibility impact and operational cost.
Signal-priority scoring model (100 points)
| Dimension | Weight | Evaluation question | Why it matters |
|---|---|---|---|
| Discovery relevance | 25 | Does the site align with your real customer intent and market? | Improves search and referral quality |
| Trust and editorial quality | 20 | Does the platform maintain quality standards? | Reduces low-signal footprint |
| Profile depth and context | 20 | Can you publish enough detail to represent the business well? | Supports better understanding and conversion |
| SEO signal durability | 20 | Is the listing likely to remain stable and useful over time? | Protects long-term contribution |
| Operational maintainability | 15 | Can your team maintain accuracy without heavy overhead? | Prevents scaling failures |
Higher total score means stronger candidate for early rollout.
Priority tiers
- Tier 1 (80-100): start here.
- Tier 2 (65-79): add after Tier 1 quality stabilizes.
- Tier 3 (<65): usually excluded unless there is a specific strategic reason.
Tiering prevents over-expansion into weak-signal platforms.
Input quality prerequisites
Before scoring business listing sites, stabilize source inputs.
| Prerequisite | Minimum standard | Risk if skipped |
|---|---|---|
| Canonical profile source | Standardized name, site, contact, and description fields | Inconsistent listing data |
| Category taxonomy | Clear mapping of primary and secondary categories | Relevance mismatch |
| Asset bundle | Current logo, screenshots/photos, offer descriptions, proof points | Thin or low-trust profiles |
| Ownership map | Named editor + approver for each wave | Unclear accountability |
| Error tracking | Structured log for rejections and corrections | Slow improvement loop |
Without strong inputs, even high-quality listing sites can underperform.
Wave-based execution model
- Score listing groups with the 100-point model.
- Choose up to three Tier 1 groups for Wave 1.
- Publish complete profiles before broadening coverage.
- Review errors and fix quality issues.
- Expand to Tier 2 only if quality metrics remain stable.
This model keeps performance and maintainability aligned.
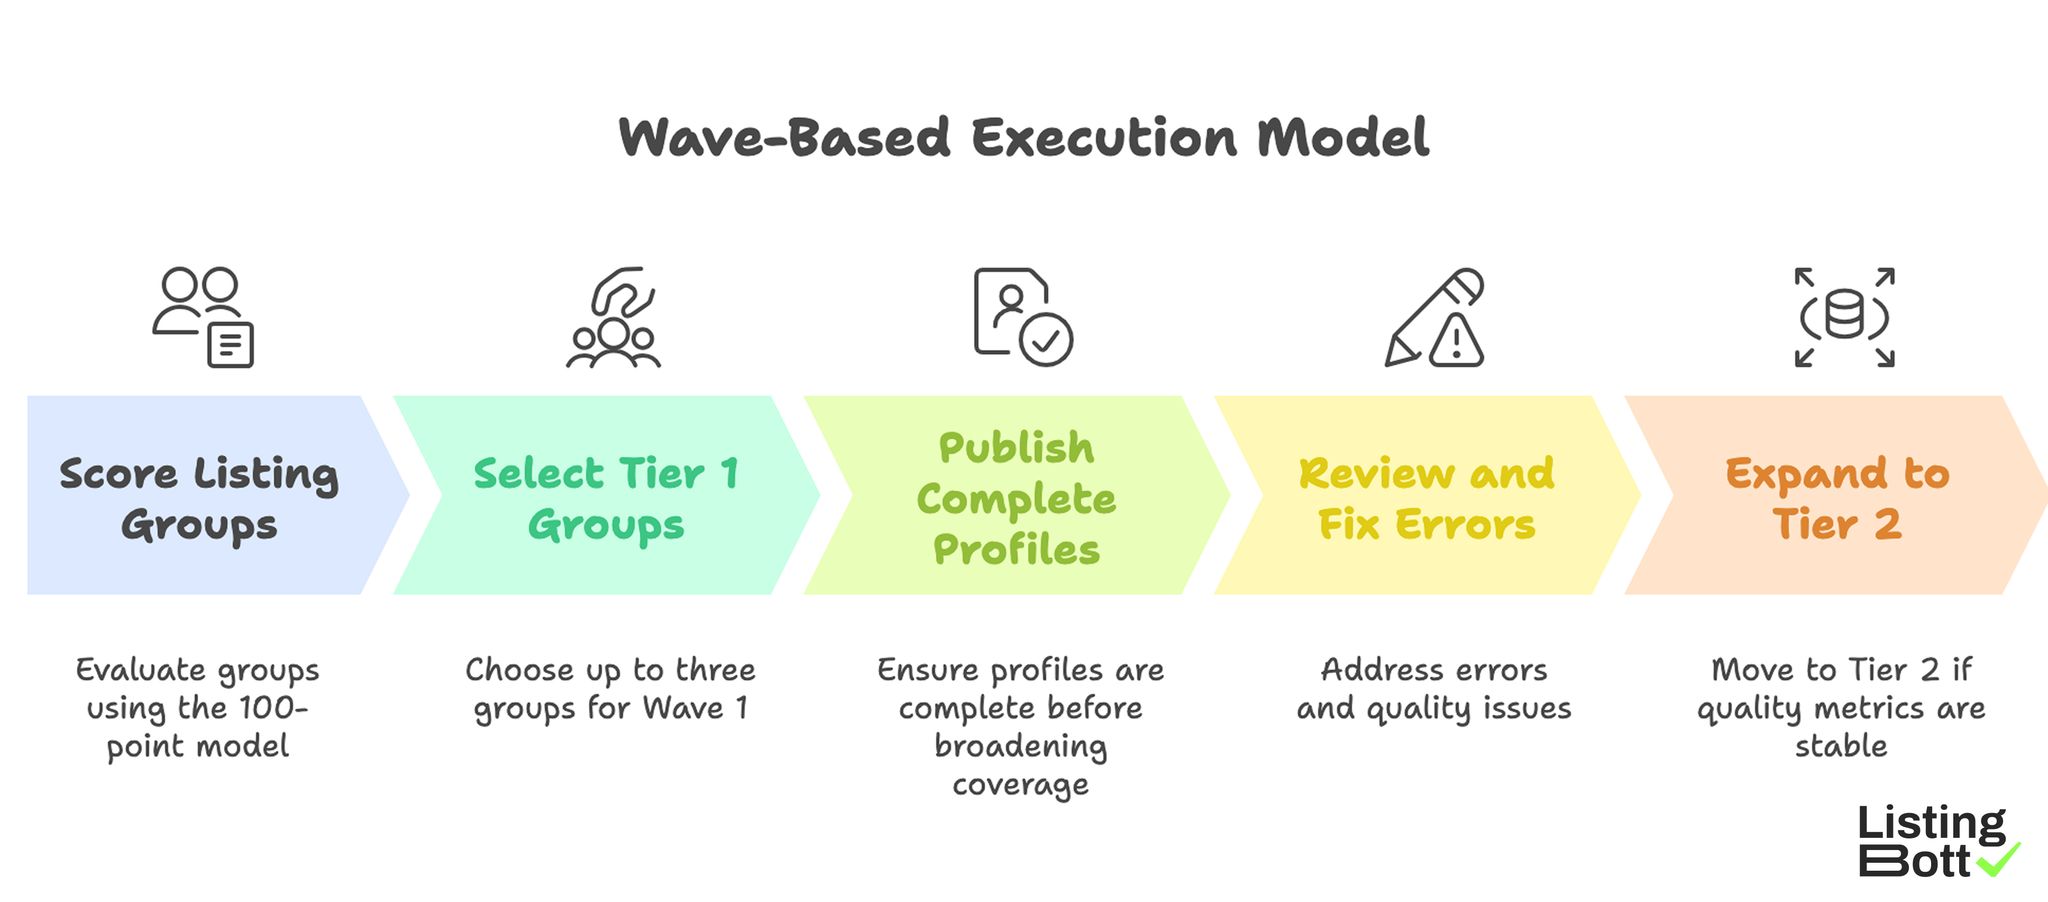
Wave-Based Execution Model
Decision thresholds for expand vs pause
Use explicit thresholds to avoid emotional scaling decisions.
| Signal | Expand when | Pause when |
|---|---|---|
| Profile completeness | Most Tier 1 listings are complete and accurate | Core fields still inconsistent |
| Correction rate | Errors trend down after each wave | Rejections or corrections are increasing |
| Team capacity | Ownership and review cadence are reliable | Updates are delayed or unowned |
| Category fit confidence | Category mapping is validated by market response | Mismatch patterns keep repeating |
This threshold approach makes listing programs easier to govern.
90-day rollout blueprint
| Window | Focus | Deliverable |
|---|---|---|
| Days 1-14 | Data readiness and scoring | Tier 1 shortlist approved |
| Days 15-40 | Wave 1 rollout | Core listings live |
| Days 41-65 | Quality stabilization | Correction backlog reduced |
| Days 66-90 | Selective expansion | Tier 2 added without quality loss |
A 90-day cadence gives enough time to improve quality before scaling volume.
KPI stack for listing program health
Track outcomes with a small KPI set so decisions are based on quality signals, not just activity volume.
| KPI | What it measures | Why it is useful |
|---|---|---|
| Profile completeness rate | Share of listings with all required fields and assets | Indicates publication quality baseline |
| Correction cycle time | Time to resolve rejected or inaccurate listings | Shows operational responsiveness |
| Category-fit error rate | Share of listings needing taxonomy corrections | Validates shortlist quality and mapping discipline |
| Stable-listing ratio | Listings that stay accurate across review cycles | Reflects durability of execution |
Review these KPIs after each wave and before expanding to new listing groups.
Comparison table
The table below compares major listing-site groups by signal value and operating reality.
| Listing-site group | Best fit | Primary upside | Main downside | Recommended priority |
|---|---|---|---|---|
| Core business/map platforms | Most local and multi-location businesses | Strong baseline discovery and consistency signal | Requires strict profile accuracy | Tier 1 |
| Vertical industry directories | Legal, healthcare, services, software niches | Better intent and category fit | Narrower total reach | Tier 1 |
| B2B software/comparison directories | SaaS and business tools | High buyer-intent context | Higher profile-depth requirements | Tier 1 or Tier 2 |
| National general directories | Broad citation and baseline presence | Wide coverage | Lower average relevance | Tier 2 |
| Community/chamber directories | Local B2B and regional service brands | Local trust reinforcement | Variable demand volume | Tier 2 |
| Low-trust bulk networks | Volume-first campaigns | Fast listing count | Weak durable value, high maintenance | Usually exclude |
Example scoring snapshot
| Group | Relevance (25) | Trust (20) | Profile depth (20) | Durability (20) | Maintainability (15) | Total |
|---|---|---|---|---|---|---|
| Core business/map | 23 | 18 | 16 | 18 | 13 | 88 |
| Vertical directories | 22 | 17 | 15 | 16 | 11 | 81 |
| B2B comparison | 20 | 16 | 17 | 15 | 10 | 78 |
| National general | 15 | 13 | 10 | 12 | 12 | 62 |
| Community/chamber | 16 | 14 | 11 | 11 | 10 | 62 |
| Low-trust bulk | 8 | 6 | 7 | 7 | 9 | 37 |
This scoring makes tradeoffs visible and easier to defend across teams.
Red-flag checklist for candidate sites
| Red flag | Detection cue | Action |
|---|---|---|
| Weak category structure | Categories are broad or inconsistent | De-prioritize or exclude |
| Low profile quality baseline | Majority of listings are thin or outdated | Exclude from active wave |
| Opaque review process | Submission outcomes are unpredictable | Keep out of Tier 1 |
| Update friction | Corrections are hard to process | Lower score for maintainability |
| Volume-first messaging | Emphasis on quantity over quality | Treat as high-risk channel |
Applying a red-flag filter before submission saves correction time later.
Shortlist by use case
Different business models need different listing portfolios. Use-case planning is more effective than one universal list.
1) Local service business
Priority stack:
- Core business/map platforms.
- Service-specific vertical directories.
- Select trust-oriented community channels.
Execution focus:
- location accuracy,
- service-category precision,
- proof assets and consistency.
2) Multi-location operating brand
Priority stack:
- Scalable core platforms.
- National directories with location support.
- Vertical channels for priority markets.
Execution focus:
- cluster rollout by region,
- location template governance,
- periodic quality audits.
3) SaaS or B2B software company
Priority stack:
- B2B software/comparison directories.
- High-fit vertical directories.
- Select general directories for baseline coverage.
Execution focus:
- clear product positioning,
- category clarity,
- complete profile context.
4) Professional services (legal, consulting, finance)
Priority stack:
- Vertical professional directories.
- Core business listings.
- Select regional trust channels.
Execution focus:
- service taxonomy accuracy,
- profile credibility,
- disciplined update ownership.
5) Startup with constrained resources
Priority stack:
- Two highest-scoring Tier 1 groups.
- No expansion until quality stabilizes.
Execution focus:
- quality-first execution,
- small-scope wave planning,
- fast correction cycles.
6) Mixed portfolio company (multiple products or segments)
Priority stack:
- Shared core platforms for all segments.
- Segment-specific vertical directories.
- Conditional general coverage by segment priority.
Execution focus:
- one canonical brand profile,
- segment-specific category overlays,
- clear ownership by segment.
Where process tooling creates leverage
A common failure point is not strategy quality, but inconsistent execution across many listing targets.
ListingBott is a one-time-payment workflow tool: intake, approved directory list, publishing process, and report handoff. It is not a consulting retainer or call-based model.
When teams need scalable business listing management with consistent controls, this workflow reduces manual coordination and helps preserve profile quality.
Risks/limits
Listing execution can strengthen consistency and support discovery, but outcomes still depend on external systems and overall site quality.
Common risk patterns
| Risk pattern | Typical cause | Mitigation |
|---|---|---|
| Over-expansion | Growing listing count faster than QA capacity | Gate expansion with thresholds |
| Profile drift | Multiple editors with no source governance | Enforce canonical profile source |
| Category mismatch | Reusing generic categories across segments | Validate taxonomy per use case |
| Correction debt | No post-wave QA cycle | Pause growth and resolve backlog |
| Misleading reporting | Tracking submissions only | Report quality + maintenance metrics |
What this process can support
- stronger consistency of business representation,
- clearer prioritization across listing options,
- more durable execution quality over time.
What this process cannot guarantee
- exact ranking position outcomes,
- fixed-date traffic results,
- guaranteed indexing speed,
- outcomes controlled by third-party listing platforms.
DR-growth condition (qualified only)
If DR growth to 15 is mentioned, it applies only when all conditions are met: starting DR below 15, explicit domain growth goal, and client-approved directory list.
Offer-policy consistency
Maintain approved public offer language:
- one-time payment model,
- publication to 100+ directories (per current website language),
- refund possible if process has not started,
- no hidden extra fees (per current FAQ language).
FAQ
1) How many listing-site groups should I include in Wave 1?
Most teams should start with two or three Tier 1 groups.
2) Are broad general directories still worth using?
Yes, but usually as Tier 2 support after high-relevance options are stable.
3) Can I scale quickly by submitting everywhere at once?
That usually creates correction debt. Controlled waves are more reliable.
4) Do listing submissions guarantee rankings?
No. Listings support discovery and consistency, but rankings depend on many external factors.
5) What should I review after each wave?
Profile completeness, error rate trend, category-fit issues, and ownership performance.
6) When should I expand beyond Tier 1?
Expand only when quality thresholds remain stable for at least one full review cycle.